Key Facts at a Glance
- Lowest Fertility Rates:
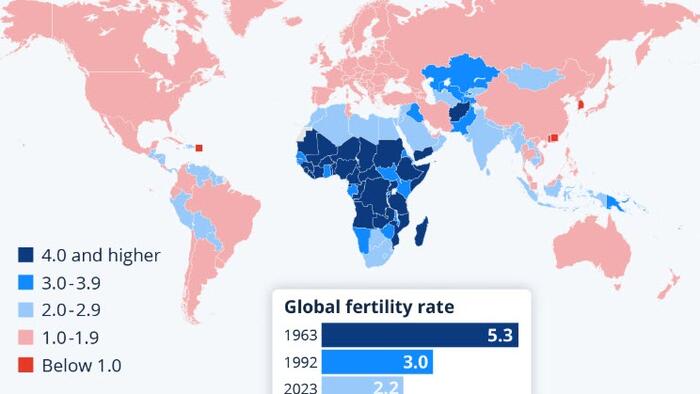
- South Korea, Hong Kong, Macau, and Puerto Rico have fewer than 1 child per woman—among the lowest globally.
- Japan: ~1.2 children per woman.
- Highest Fertility Rates:
- African nations dominate: Somalia, Chad, Niger, and the Democratic Republic of the Congo lead with 6.1 children per woman.
- 29 of the 31 countries with 4+ children per woman are in Africa.
Why Do Fertility Rates Vary?
- Wealthier Countries (e.g., Japan, South Korea):
- Women have fewer children due to education, career opportunities, and access to birth control.
- Population growth relies more on immigration.
- Developing Nations (e.g., Somalia, Niger):
- Higher birth rates due to limited healthcare, education, and cultural norms.
- Drive global population growth despite global decline in fertility.
The Big Picture: Population Growth vs. Fertility
- Global fertility has HALVED since 1963:
- 1963: 5.3 children per woman.
- 2023: 2.2 children per woman.
- Yet, the population TRIPLED in the same period:
- 1963: 3.2 billion people.
- 2023: 8.1 billion people.
Why?
- People live longer (↑ life expectancy).
- Fewer children die young (↓ child mortality).
What’s Next?
- By 2050: Global fertility is expected to hit the “replacement level” (2.1 children per woman)—the “sweet spot” to keep populations stable.
- By 2100: Global population may start declining as fertility drops below replacement.
Simple Analogy
Think of population like a bathtub:
- Fertility rate = Water flowing in.
- Life expectancy = Water staying in (less draining out).
Even if the tap (fertility) slows, the tub (population) keeps filling if the drain (deaths) is slow.
Takeaway
While fewer children are born globally, better healthcare and longer lives mean our population grows for now. But trends suggest a shift toward stability—and eventual decline—by the next century.